4.5. Gender Demographics#
What is the gender balance in my course? Knowing the male-female ratio in your course can help you understand who is enrolling in your course and whether the balance changes over time.
Learner demographic data is updated every day to include changes in enrollment through 23:59 UTC the previous day.
4.5.1. Gaining Insight into Learner Gender#
Learners can identify themselves with a gender by selecting Female, Male, or Other/Prefer Not to Say when they register for an account on edx.org or edge.edx.org. Learner gender data is provided in a chart and a report that you can view or download. Descriptions follow; for detailed information about the computations, see Computation Reference.
4.5.1.1. Self-Reported Learner Gender Chart#
The bars on this chart represent the most recently calculated percentage of enrolled learners who reported a gender of Female, Male, or Other/Prefer Not to Say. Moving your cursor over the chart shows the percentage for each selection, calculated to one decimal place.
Learner gender data is also available for review in tabular format and can be downloaded.
An example of this chart follows.
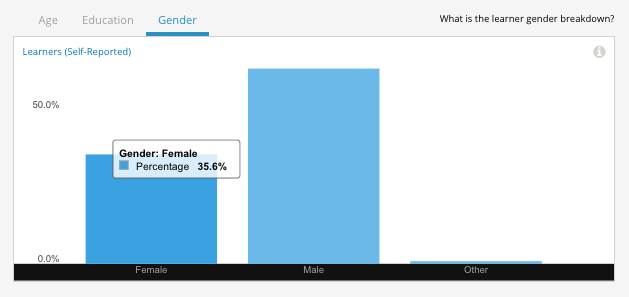
This chart is for a science course, and learners’ median age is 25. The course team might use the percentages of enrolled men and women as a starting point for an investigation into how learners learn about their course and make the decision to enroll in the course.
See the Computation Reference for a detailed description of how learner gender values are computed.
4.5.1.2. Gender Breakdown Over Time Report#
The daily count of currently enrolled learners, with gender breakdown, is available for review or download. Columns show each date, the current enrollment as of that date, and breakdown columns for the number of people who reported each gender category and who did not provide this information at registration.
To download the Gender Breakdown Over Time report in a comma-separated value file, click Download CSV. The CSV file contains the following columns:
course_id
created (the date and time of the computation)
date
female
male
other
unknown
4.5.2. Analytics in Action: Interpreting Gender Distribution#
4.5.2.1. Researching an Unanticipated Disparity#
Not long before launch, the team for a math MOOC checked the demographics for the learners who had enrolled. They were surprised to observe a gender imbalance that was far more acute than they had ever seen in their on-campus version of the class.
The team looked into possible contributing factors, and realized that the audiences of the journal articles and blog posts that had been written about the course skewed heavily male. They also reread the course About page to see if it represented the course differently than they had intended.
Even more important to the team than finding potential causes was to make an effort to enroll more women in the course. To do so, the team subsequently partnered with professional women’s organizations for guidance on ways to market the course to their members.
Today, teams can use edX Insights to monitor the success of such outreach efforts by checking the Gender Breakdown Over Time report and CSV file for enrollment trends.