4.6. Enrollment Geography#
Where are my learners from? Enrollment geography data helps you understand the global reach of your course.
Enrollment geography data is updated every day. Changes in the locations for enrolled learners through the end of the previous day (23:59 UTC) are included.
4.6.1. Gaining Insight into Learner Location#
EdX Insights delivers data about learner location in a map, a set of metrics, and a report that you can view or download. Descriptions follow; for detailed information about the computations, see Computation Reference.
4.6.1.1. Geographic Distribution Map#
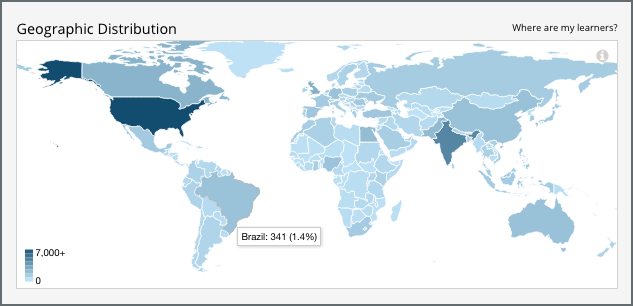
The map uses a color scale to indicate the percentage of current course enrollment represented by learners from each country or region. The darker the shade, the higher the enrollment percentage. You can view the current enrollment count for each country or region by moving your mouse over the map.
In this example, the country or region with the highest number of enrolled learners is the United States. The cursor is pointing to Brazil, and a tooltip shows the number and percentage of learners enrolled in the course from that country or region.
4.6.1.2. Total Countries or Regions Represented Metric#
This metric reports the number of countries or regions in which one or more learners are located.
4.6.1.3. Top Country or Region by Enrollment Percentage#
This statistic reports the country or region with the highest percentage of learners.
4.6.1.4. Second Country or Region by Enrollment Percentage#
This statistic reports the country or region with the second highest percentage of learners.
4.6.1.5. Third Country or Region by Enrollment Percentage#
This statistic reports the country or region with the third highest percentage of learners.
4.6.1.6. Geographic Breakdown Report#
The columns in this report show each Country or Region and its Percentage and Current Enrollment. Learners whose location cannot be determined are reported in the “Unknown” category.
To download the Enrollment Over Time report in a comma-separated value file, click Download CSV. The CSV file contains the following columns:
count
country.alpha2 (the two-character ISO 3166 country code)
country.alpha3 (the three-character ISO 3166 country code)
country.name
course_id
created (the date and time of the computation)
date
Note
The CSV file is UTF-8 encoded, but not all spreadsheet applications interpret and render UTF-8 encoded characters correctly. For example, a French country name that includes accented characters displays differently in Microsoft Excel for Mac than in OpenOffice Calc. If you notice characters that do not display as expected, try a spreadsheet application such as LibreOffice, OpenOffice Calc, or Apache OpenOffice to open the CSV file.
See the Computation Reference for a detailed description of how location values are determined.
4.6.2. Analytics in Action: Interpreting Geographic Distribution#
4.6.2.1. Teaching with a Global Reach#
To make their courses more welcoming to a geographically and culturally diverse learner body, team members have changed their courses in a variety of ways.
A team in the United States realized that they had almost as many learners from India enrolled as from their own country or region. To provide the same experience to learners participating across a time difference of more than nine hours, the team adjusted their schedules so that discussion moderation coverage covered more hours in each day.
After he identified the top few countries or regions where learners in his course were located, one professor made a quick change to some of the homework problems. Instead of using first names that are only common among American and European learners in the problem text and examples, he sprinkled in names that would be familiar to learners in India, Colombia, and China.
The same professor also checked the scheduled due dates for his course assignments, and found that it made sense to change a due date that fell on a major festival day in India.
4.6.2.2. Investing Based on Demonstrated Need, Not Predictions#
Delivering content, especially videos, to learners in every country or region in the world means meeting differing technological requirements. Instead of working to make every video available to a global audience before the course started, one team took more of a wait-and-see approach. In the months leading up to the course start date, the team tracked the number of learners who, based on location, could only access videos if they were hosted on a third-party site. The team was able to use the actual number and percentage of learners from the affected country or region in their justification of the increased costs of creating the alternate video delivery channel.
4.6.2.3. Fostering Community#
When learners enroll in a course and click through from the edX dashboard, they see the course Home page first. One professor welcomed learners into the course community by including enrollment data from previous iterations of his course. By showcasing the size and geographic reach of the course in this way, the professor used the “wow” factor of his MOOC to capture interest and escalate enthusiasm.