7.1. Learner Activity
Which learners, specifically, are engaging with my course? Who is struggling, and who is doing well? Investigating and comparing the activities of individual learners helps you focus on those who are most likely to benefit from additional attention.
Learner data is updated every day to include activity through the end of the previous day (23:59 UTC).
7.1.1. Gaining Insight into Individual Learner Activities
Insights delivers data about the activities of individual learners in a report and in charts of activity over time. Descriptions of the report and charts follow; for detailed information about the computations, see Individual Learner Computations.
7.1.1.1. Learner Roster and Key Activity Report
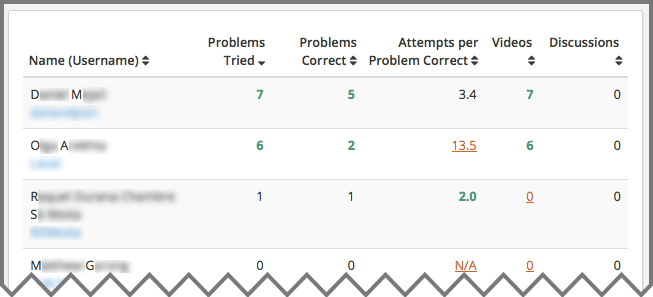
Insights delivers data about the engagement of individual learners by providing counts for the following key activities.
- Problems Tried
- Problems Correct
- Attempts per Problem Correct
- Videos played
- Discussion contributions added
The report includes one row for every learner who ever enrolled in the course. The reported metrics represent each learner’s activity in the course during the last seven days, through end of day (UTC) yesterday.
7.1.1.1.1. Reviewing the Report
To review the learner roster and key activity report, select Learners at the top of any Insights page. By default, the report shows data for all learners.
To find data that is of interest to you, the report includes the following options.
- Sort by username or by an activity metric, in ascending or descending order.
- Search for a learner by name or username.
- Filter the report to include only learners who have completed one or more of the key activities in the last 14 days. (However, note that only metrics for the last seven days are reported. As a result, this filter might also help you identify learners who have disengaged during the past week.)
- Select an enrollment track to report only learners who are enrolled in that track.
- Select one cohort (in a course that includes learner cohorts).
To help you compare an individual learner’s level of engagement to that of the class as a whole, the numbers on the report include these color and font cues.
- Red, underlined: The learner’s activity is in the 15th percentile or below. These values can indicate learners who might be falling behind or struggling.
- Green, bold: The learner’s activity is in the 85th percentile or above. These values can indicate learners who might be doing particularly well.
- Black: All other values.
An example roster follows. In this example, the report is sorted in descending order by number of problems tried.
7.1.1.2. Learner Activity Chart
To review the learner activity chart, you select the learner’s username in the learner roster and key activity report.
The learner activity chart is a timeline that shows when a selected learner was active in the course. The markers on this chart represent the number of times the learner interacted with the course each day. The graph plots the following types of activity.
- Discussion Contributions
- Problems Correct
- Videos Viewed
The chart shows when a learner was active in the course, beginning with the first day that one of these activities took place, and ending with the last day that one these activities took place. Unlike the roster, this timeline is not limited to activity in the last seven days.
Examples of learner activity charts follow. The first example shows the activity chart for a learner who often plays 10 or more course videos per day. However, the learner is not answering any problems correctly, and has not yet contributed to the discussions.
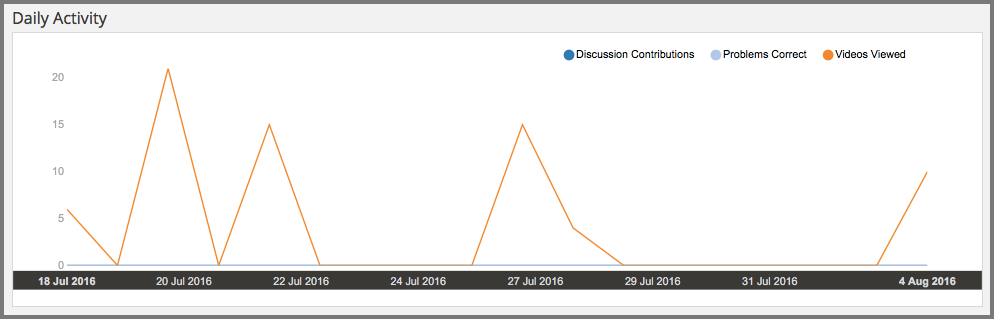
This learner might be getting exactly what they want out of the course, the opportunity to learn from the videos. However, to get a more complete understanding of this learner’s experience, you could go back to the learner roster and key activity report to see if this learner is attempting to answer problems, but not managing to answer any correctly.
The next example shows the activity chart for a learner who occasionally watches videos, and who has not yet contributed to the discussions. However, there were only two days on which this learner answered any problems correctly. The tooltip shows the counts for each type of activity on one of those days.
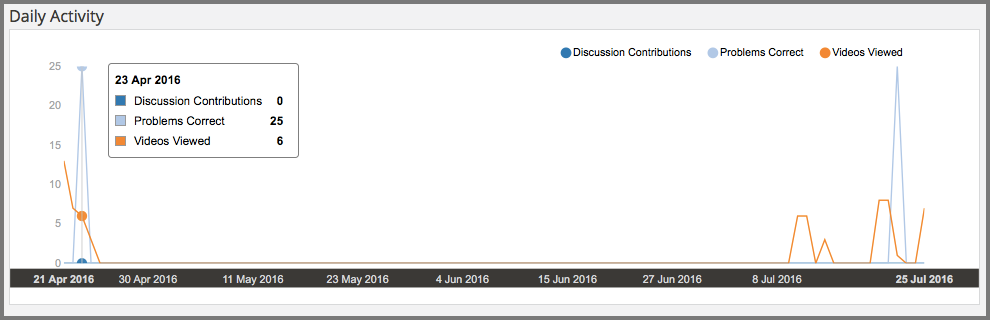
Knowing the context of how your course is set up, this pattern might indicate that the learner completed the first homework assignment in your self-paced course and then, after some weeks off, completed the second homework assignment. Or, it might indicate that the learner started your instructor-paced course on schedule, but is now rushing to complete the remaining graded assignments before the end of the course.
7.1.1.2.1. Sending Email Messages to Learners
To make taking action to help a struggling learner, reengage an inactive learner, or recognize the achievement of a successful learner easier, the learner activity chart includes the learner’s email address. You can select the email address to send a message directly to that learner.
Before you use Insights to send email messages to learners, note that this feature is different from the bulk email feature that is available on the instructor dashboard of an edx.org course.
- Selecting a learner email address in Insights opens the default email client of the computer that you are currently using. As a result, if you use your personal computer to access Insights, your personal email address might be the default for sending the message. Be sure to use only your official institution email address when you communicate with learners by email.
- Insights does not log when messages are sent, or record the email address of the sender or the recipient.
When you use Insights, be sure to follow your organization’s guidelines for communicating with learners.
7.1.1.3. Activity Over Time Report
A report of specific course activities that the learner completed each day is available for review. Columns show the counts of Discussion Contributions, Problems Correct, and Videos Viewed.
See the Computation Reference section for a detailed description of each value.
7.1.2. Analytics in Action: Interpreting Individual Activity Patterns
A review of how many times each of the learners in your course completed key activities, and when, can help you identify learners who are most likely to need some form of intervention.
7.1.2.1. Identifying Learners Who Are At Risk
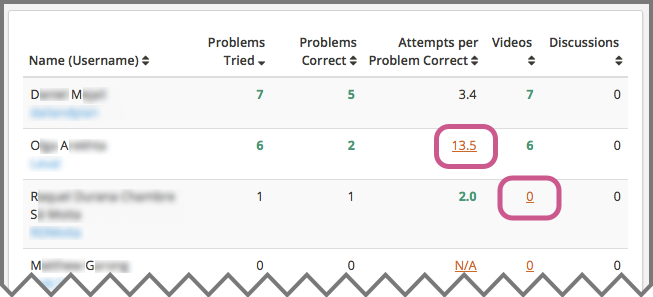
To identify learners who are falling behind, and who might be at risk of failing, course teams can use the identifiers for activity in the 15th percentile and below on the learner roster and key activity report. For example, a course team member can sort the report using any of the metrics, and then scan the report to locate any learners with a value that is underlined and in red. In the example that follows, reported values in the 15th percentile and below are circled.
When you review the report, your knowledge of the context can help you decide whether, and how, to intervene. Some possible scenarios follow.
- The course is a small private online course and it began three days ago. The report shows that many learners are engaging with the course, though some more than others. You decide to send an email message to all enrolled learners at the end of the first week to congratulate them on their efforts so far, and to point out that they can track their own achievements on the Progress page.
- The course is an on campus course, and the third week just started. You use the report to identify the learners who are not on pace to complete the course successfully, but who might be able to catch up. You make sure that all of your teaching assistants know how to use the report to identify such learners in their sections.
You can use the learner activity report throughout the course run to guide your decisions about when, and how, to contact learners who are struggling.
7.1.2.2. Promoting Learner Interaction
A course has several small cohorts with a teaching assistant (TA) assigned to each one. The members of these cohorts are expected to contribute to the discussions at least once a week throughout the course run. In turn, the TAs are responsible for making sure that any questions that cohort members post in the course discussions get prompt and thorough answers.
The learner roster and key activity report can make monitoring discussion activity easier for these TAs. The cohort filter and column sorting features can help them identify the cohort members who are contributing to the discussions. They can also search by username to find the activity reported for individual cohort members. The learner activity charts can show, at a glance, whether discussion activity is a regular part of a learner’s weekly involvement in the course, or if it takes place more sporadically.
7.1.2.3. Identifying Questionable Activity
Certain activity patterns can alert you to behavior that might be either exemplary or counterproductive. You can use learner data to identify unusual combinations of activity and decide whether to investigate further. Examples follow.
- A learner has a high problems correct total, and a very low ratio of attempts per problem correct: a top performer. When you look at that learner’s activity chart, however, you see that all of the problems were answered correctly on the very first day the course opened. Did this learner enroll in the audit track for a previous course run, and is now taking the course for a second time in the verified track? Or, could this learner have violated the honor code?
- A learner is in the 85th percentile (or above) for discussion contributions: a highly engaged community member. However, the same learner has zero problems attempted and zero videos played, so the discussions are the only type of key course activity in which the learner engages. Is this learner answering questions thoughtfully and with accurate information?