6.1. Graded Content Submissions#
How are learners answering questions? In edX Insights, graded content submissions show you the responses that learners submit for graded problems, and help you evaluate what they find difficult. To illustrate, this section presents the Analytics in Action section first.
6.1.1. Analytics in Action: Interpreting Graded Submissions#
A review of the distribution of learner answer submissions for a graded problem can lead to discoveries about your learners and about your course.
You can assess how difficult the problem is for learners to answer correctly.
You can detect common mistakes.
You can understand learner misconceptions.
You can find errors in problem components.
In addition, you can use the stacked bar chart presented for each course assignment type and assignment to identify where learners are submitting relatively more incorrect answers.
6.1.1.1. Researching Unexpected Difficulties#
For problem types that provide both the question and a set of possible answers (checkboxes, dropdown, and multiple choice), submission data helps you assess how difficult it is for learners to identify and submit the correct answer. The submissions chart provides a visual contrast of the number of learners who select incorrect answers with the number who answer correctly.
If the proportion of learners who answer the problem incorrectly surprises you, research can reveal a variety of causes. Your investigation might begin with some of these questions.
Is the text of the question and of its possible answers clear? Has it been translated accurately?
Does the course outline include relevant course content before the problem, or after it?
Are all of the course prerequisites presented to potential learners?
Does the problem rely on learner access to a video or textbook? Are there transcripts for the videos, and can the textbook files be read by a screen reader?
Are learners relying on conventional wisdom to answer the question instead of newly acquired knowledge?
The results of your investigation can guide changes to future course runs.
6.1.1.2. Investigating Similar Responses#
For open-ended problem types that provide only the question (numerical, text, and math expression input), submission data can help you identify similar responses. In the Submission Counts report, you have access to every answer submitted by a learner. The chart, however, presents only the 12 most frequently submitted responses. Your initial investigation into how learners answer a question can begin with this set of 12.
For example, the edX Demo course includes a text input problem that has a correct answer of “Antarctica”. The problem is set up to recognize variations in capitalization for this English spelling as correct.
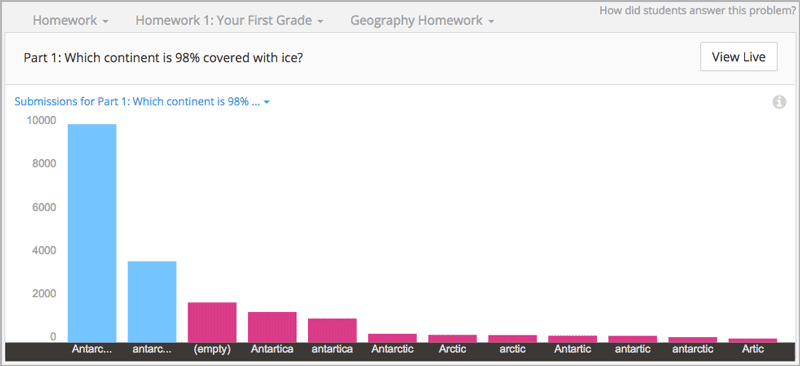
When you review the submissions chart for the problem, you see that the two most frequently submitted answers are both marked correct: Antarctica and antarctica. You also note that several misspelled variations, including “Antarctic” and “Antartica”, are marked incorrect.
A review of the Submissions Count report reveals several more variations, including “antartika”, “Antartide”, and “el continente Antártico”. You realize that these answers also indicate the continent of Antarctica, but in languages other than English. Seeing answers such as these in the report might reassure you that more learners understand the question and the relevant course material than is indicated by the correct answer count. You might decide to reconfigure the problem so that correct answers in other languages also evaluate as correct. Alternatively, you might decide to revise the question to specify that answers be given in English only.
6.1.1.3. Reviewing Answers to Complete Course Setup#
Before the release date of each section, you encourage your beta testers to answer every question and to submit both correct and incorrect answers. You then use edX Insights to review the answers that your testers submit for each problem. You verify that each problem is set up as you intend, and correct any oversights before learners can encounter them.
In this way, you can use edX Insights to validate the grading configuration, and to proofread the display names, accessible labels, and text that you have provided for the graded assignment types, assignments, problems, questions, and answers.
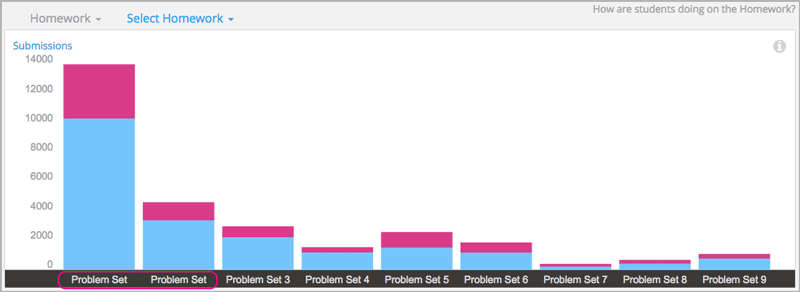
For example, the first time you use edX Insights to look at learner performance, you choose the “Homework” assignment type. In the chart of the homework assignments, you see the nine assignments that you expect. However, you notice that for your first two homework assignments, you forgot to include the distinguishing number after the name “Problem Set”.
In another example, you use edX Insights to check the answers that your beta testers submitted for one of the questions in a quiz. You notice that the chart for this question does not have a title. For this problem component, you neglected to identify the question with an accessible label.
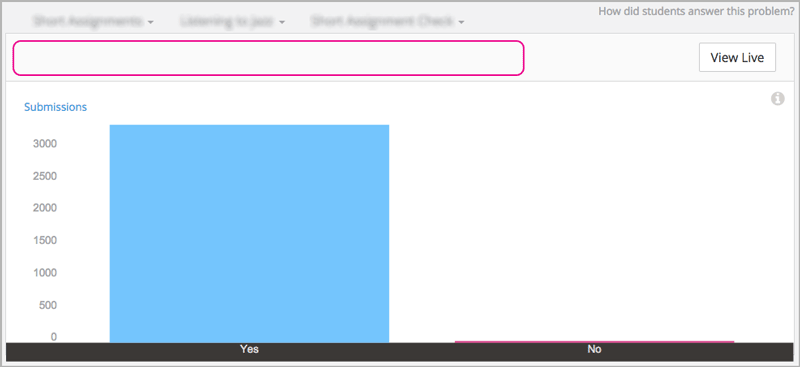
You can select View Live to see what the problem looks like in the LMS, and from there select View Unit in Studio to add the missing accessible label to the problem.
In this last example, when you see the chart for an assignment you realize that you did not change the default display name, “Multiple Choice”, for any of the problems that it includes.
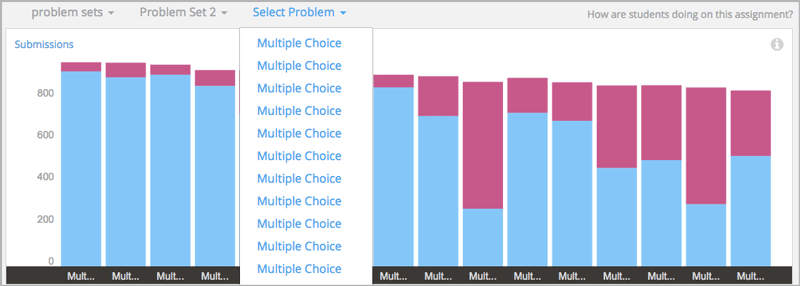
Because learners also see problem display names in the LMS, you might decide to go back to Studio and provide identifying display names for the problems before you publish the subsection.
6.1.2. Selecting the Assignment Type, Assignment, and Problem#
To access data about the answers that learners submit for a graded problem component, you make these selections.
Step 1: Select a graded course assignment type.
Step 2: Select an assignment.
Step 3: Select a problem.
EdX Insights provides data for each selection that you make.
6.1.2.1. Step 1: Select an Assignment Type#
After you select Performance and Graded Content, edX Insights displays the assignment types that make up the grading configuration of the course. You use the drop-down Select Assignment Type menu or click an item in the grading configuration to select the assignment type to investigate.
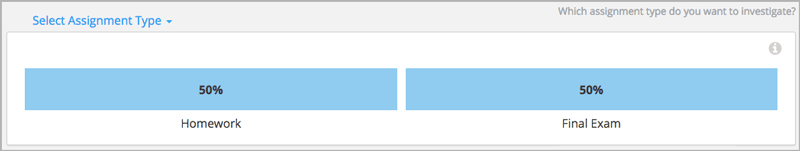
For information about defining course assignment types, see Establishing a Grading Policy.
6.1.2.2. Step 2: Select an Assignment#
After you select one of the course assignment types, edX Insights displays a stacked bar chart that summarizes learner performance on each assignment of that type.
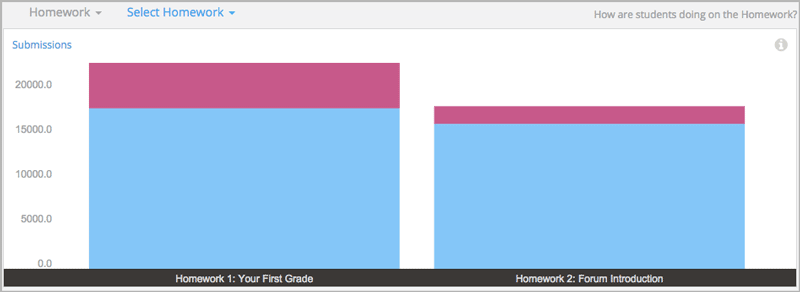
The Assignment Submissions report on this page provides the number of problems in each assignment. The report also includes the correct and incorrect submissions received. These values are averaged by the number of problems in each assignment.
For information about identifying the graded subsections in a course, see Set the Assignment Type and Due Date for a Subsection.
You use the drop-down Select {Assignment Type} menu or click a bar in the chart to select the assignment you want to examine further.
6.1.2.3. Step 3: Select a Problem#
After you select an assignment, edX Insights displays a stacked bar chart that summarizes learner performance on each problem in that assignment. In this example from the edX Demo course, the selected homework assignment includes just one problem.
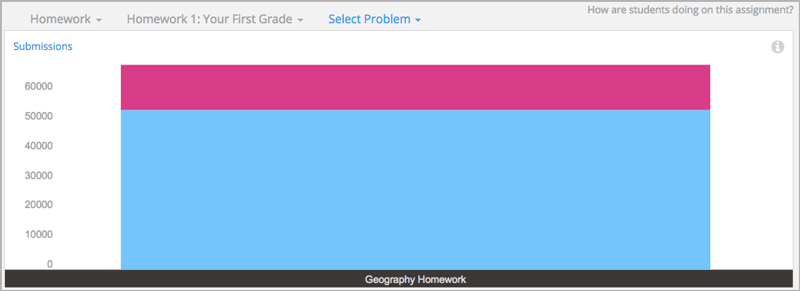
The Problem Submissions report on this page includes a row for each problem and provides the number of correct and incorrect submissions received for each one.
For information about adding a unit to a subsection, see Create a Unit.
You use the drop-down Select Problem menu, or click a bar in the chart, to select the problem that you want to examine further.
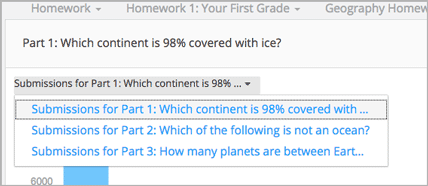
If the problem that you select includes more than one part (or question), the first part appears. To select a different part, you use the Submissions for Part {number} drop-down. In the Demo course example, the selected homework problem has three parts.
6.1.3. Review Answers to Graded Problems#
After you select a problem or problem part, edX Insights displays submission data in a bar chart and a report that you can view or download. Descriptions of the chart and report follow. For detailed information about the computations, see Computation Reference.
Note
Problems that use the Randomization setting in Studio result in many possible submission variants, both correct and incorrect. As a result, edX Insights does not attempt to present a chart of the responses submitted for these problems. You can download the Submissions Counts report to analyze the answers that are of interest.
6.1.3.1. Submissions Chart#
The bars on this chart represent the number of enrolled learners who submitted a particular answer to a question in a problem component. The x-axis includes the most frequently submitted answers, up to a maximum of 12. Due to space limitations, the answer text that is used to label the x-axis might be truncated. Moving your cursor over each bar shows a longer version of the answer.
To review the problem component in the LMS as a learner sees it, select View Live and then at the top of the page use the View this course as option to select Learner. The LMS displays the page that contains this problem in Learner View. For more information, see View Your Live Course.
All submitted answers, and complete answer values, are available for review in tabular format at the bottom of the page and can also be downloaded.
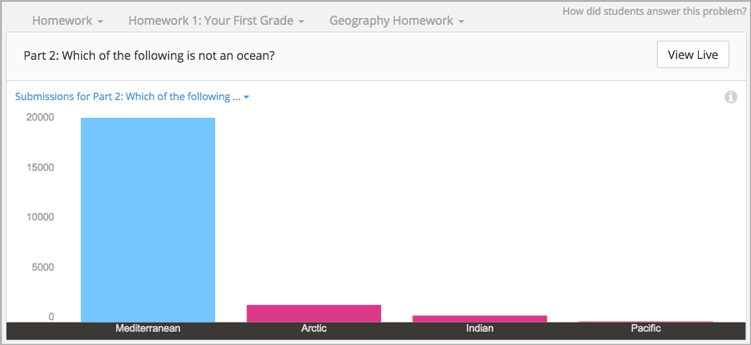
Examples of the graded content submissions chart follow. In the first example, most learners selected the correct answer for a multiple choice problem.
The second example shows the graph of the top 12 answers submitted for a numerical input problem. Most learners left the answer for this question blank, or “(empty)”, which was marked incorrect. Other answers that learners submitted, both correct and incorrect, are also graphed. The Submission Counts report includes a row for every submitted answer.
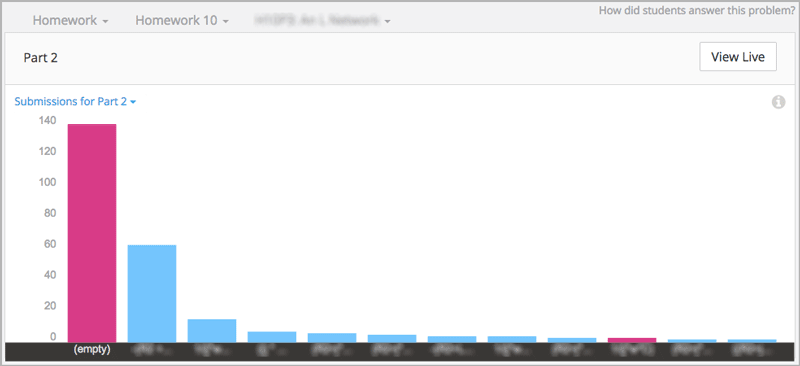
For more information, see the Computation Reference.
6.1.3.2. Submission Counts Report#
A report with a row for each problem-answer combination submitted by your learners is available for review or download. The report columns show each submitted answer, identify the correct answer or answers, and provide the number of learners who submitted that answer.
To download the Submission Counts report in a comma-separated value file, select Download CSV.
The report includes one row for each problem-answer combination submitted by a learner. Only the most recent attempt submitted by each learner is included in the count. For example, consider a dropdown problem that has five possible answers. The report or file contains up to five rows, one for each answer submitted by at least one learner in their last attempt to answer the problem.
If the problem that you select includes more than one part, the chart and report for the first part appears. To select a different part, you use the Submissions for Part {number} drop-down.
For problems that use the Randomization feature in Studio, the report has one row for each problem-variant-answer combination selected by at least one learner. For more information about this randomization option, see Randomization.
See the Computation Reference for a detailed description of each column.