6.2. Ungraded Problem Submissions#
How do learners answer problems that do not count toward their course grades? Do they answer these questions at all? Using edX Insights, you can review data for the ungraded problems in a course and its sections. This data shows you how many learners are submitting answers, and the average number of answers that are correct.
Then, you can review the actual responses learners make to questions that are not part of the grading configuration for your course. You can also compare data about ungraded and graded course content. Information about learner performance on ungraded problems can help you understand where learners are making errors, and also find ways to improve the problems.
6.2.1. Analytics in Action: Interpreting Ungraded Submissions#
A review of the distribution of answer submissions for an ungraded problem can lead to discoveries about your learners and about your course.
6.2.1.1. Initial Assessments#
Ungraded problems that are included early in the courseware can provide valuable information about how well prepared enrolled learners are to complete your course successfully. You can use edX Insights to answer questions like these.
What percentage of enrolled learners completed the initial set of exercises?
Do the submissions demonstrate the core competencies that you expect?
Do the submissions reflect common misconceptions?
The illustration that follows is for a course that includes a preliminary assessment during “Week 0”. The chart includes one bar for each of the problems in the subsection that contains the assessment. The average number of incorrect answers, in pink, is stacked on top of the average number of correct answers, in blue, in each bar. The chart indicates that for most of the questions in the preliminary assessment, a significant percentage of learners submitted an incorrect answer.
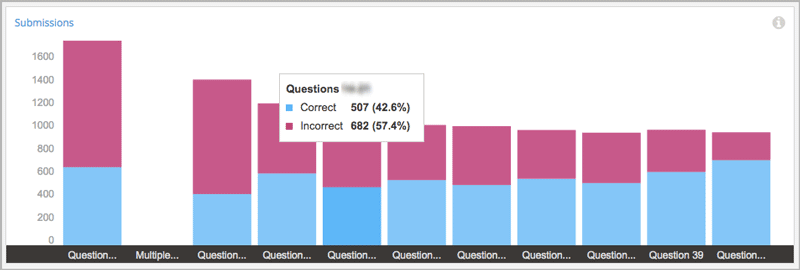
Reviewing this information early in the course run can help you decide whether to take any action, and what that action might be. For example, if relatively few of the enrolled learners are answering the question, you might decide to add a link to the edX DemoX course on your Course Info page. To help learners understand course prerequisites better, you could upload references to additional preparatory material. Or, you could decide to post more frequently, and with more detail, in the content-specific course discussions.
6.2.1.2. Practice Problems#
To give learners opportunities to practice, gain confidence, and learn from their mistakes, many courses include ungraded problems throughout. The data available for practice problems in edX Insights can help you answer questions like these.
What percentage of learners submit answers to the practice problems? Does that percentage change over time?
Do more learners answer the practice problems or the graded problems?
Do more learners answer the practice problems correctly, or the graded problems?
The illustration that follows is for a course that includes ungraded practice problems in most sections. The chart includes one bar for each section in the course. Each bar shows the average number of incorrect answers for the entire section, in pink, stacked on top of the average number of correct answers, in blue. These values are averaged by the number of problems in each section.
In this course, the number of learners submitting answers in each section went down over time. However, the number of learners who submitted the correct answer went up.
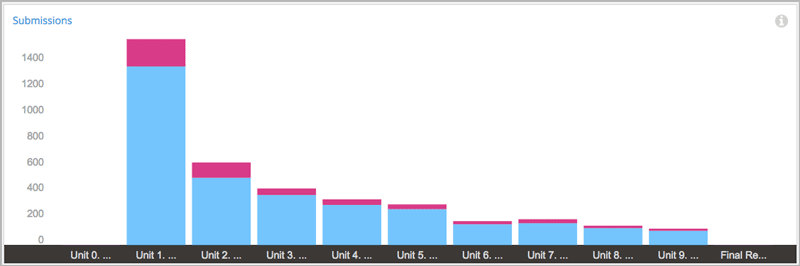
You can use this data for course sections and subsections to track changes in how many learners are working through the practice problems. You can also compare the answers submitted for similar ungraded and graded problems. Depending on what you find, you might consider changes to future versions of the course. For example, you might add or revise the explanations for the practice problems, add hints or feedback, or increase the number of attempts that learners have to submit the correct answer. You might also be able to find and address differences in problem difficulty.
6.2.1.3. Surveys#
If you use problem components to survey your learners, you can use edX Insights to review their responses. The data available for survey-type problems in edX Insights can help you answer questions like these.
How many learners responded?
For questions with a limited number of possible answers, such as multiple choice, what percentage of learners selected each answer?
For open-ended questions, such as text input, what did learners submit?
The illustration that follows shows the number of learners who selected each of the choices offered for a multiple choice question. The chart includes one bar for each answer.
Note
If you do not explicitly identify a correct answer for a question in Studio, all submitted answers are marked as incorrect. As a result, the bar charts for these questions appear in a single color.
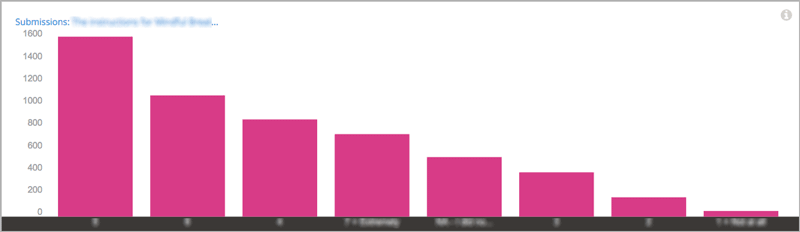
The downloadable reports of answer data that are available from Insights can aid further analysis of survey answers.
6.2.2. Selecting the Section, Subsection, and Problem#
To access data about the answers that learners submit for an ungraded problem component, you make these selections.
Step 1: Select a section in the course.
Step 2: Select a subsection.
Step 3: Select a problem.
EdX Insights provides data for each selection that you make.
6.2.2.1. Step 1: Select a Section#
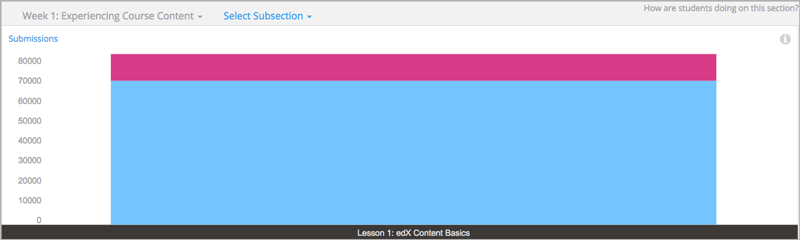
After you select Performance and Ungraded Problems, edX Insights displays a stacked bar chart that summarizes learner performance on ungraded problems in every section in the course.
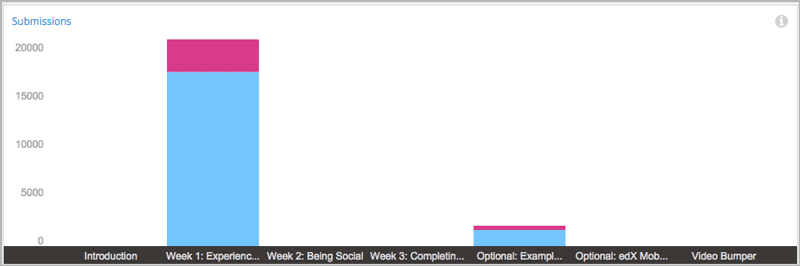
The graph includes a bar for a section only if that section both contains an ungraded problem and at least one learner has submitted an answer. You use the drop-down Select Section menu, or click a bar in the chart, to select a section to investigate.
The Section Submissions report on this page provides the number of ungraded problems in each course section, and the average number of correct and incorrect submissions received based on the number of problems in each section.
6.2.2.2. Step 2: Select a Subsection#
After you select the course section, edX Insights displays a stacked bar chart that summarizes learner performance on the ungraded problems in each subsection. In this example from the edX DemoX course, there is only one subsection in the selected section.
The Subsection Submissions report on this page provides the number of ungraded problems in each subsection and the number of correct and incorrect submissions received, averaged by the number of problems in each section.
You use the drop-down Select Subsection menu or click a bar in the chart to select the subsection you want to examine further.
6.2.2.3. Step 3: Select a Problem#
After you select a subsection, edX Insights displays a stacked bar chart that summarizes learner performance on each problem in that assignment. In this example from the edX Demo course, the selected subsection includes four problems.
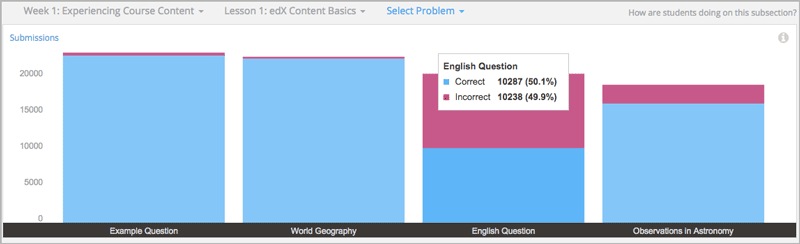
The Problem Submissions report on this page includes a line for each of the problems in the selected subsection, and the number of correct and incorrect submissions received for each one.
You use the drop-down Select Problem menu, or click a bar in the chart, to select the problem that you want to examine further. If the problem that you select includes more than one part (or question), the first part appears. To select a different part, you use the drop-down Submissions for Part {number} menu.
6.2.3. Review Answers to Ungraded Problems#
After you select a problem or problem part, edX Insights displays submission data in a bar chart and a report that you can view or download. Descriptions of the chart and report follow. For detailed information about the computations, see Computation Reference.
Note
Problems that use the Randomization setting in Studio result in many possible submission variants, both correct and incorrect. As a result, edX Insights does not attempt to present a chart of the responses submitted for these problems. You can download the Submissions Counts report to analyze the answers that are of interest.
6.2.3.1. Submissions Chart#
The bars on this chart represent the number of enrolled learners who submitted a particular answer to a question in a problem component. The x-axis includes the most frequently submitted answers, up to a maximum of 12. Due to space limitations, the answer text that is used to label the x-axis might be truncated. Moving your cursor over each bar shows a longer version of the answer.
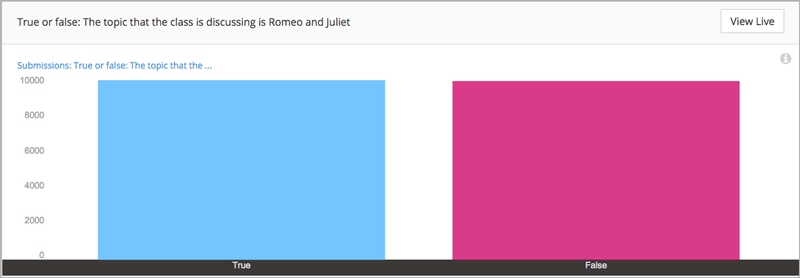
To review the problem component in the LMS the way a learner sees it, select View Live and then at the top of the page use the View this course as option to select learner. The LMS displays the page that contains this problem in learner View. For more information, see View Your Live Course.
All submitted answers, and complete answer values, are available for review in tabular format at the bottom of the page and can also be downloaded.
For more information, see the Computation Reference.
6.2.3.2. Submission Counts Report#
A report with a row for each problem-answer combination submitted by your learners is available for review or download. The report columns show each submitted answer, identify the correct answer or answers, and provide the number of learners who submitted that answer.
To download the Submission Counts report in a comma-separated value file, select Download CSV.
The report includes one row for each problem-answer combination submitted by a learner. Only the most recent attempt submitted by each learner is included in the count. For example, consider a dropdown problem that has five possible answers. The report or file contains up to five rows, one for each answer submitted by at least one learner in their last attempt to answer the problem.
If the problem that you select includes more than one part, the chart and report for the first part appears. To select a different part, you use the Submissions for Part {number} drop-down.
For problems that use the Randomization feature in Studio, the report has one row for each problem-variant-answer combination selected by at least one learner. For more information about this randomization option, see Randomization.
See the Computation Reference for a detailed description of each column.