11.12. Student Grades and Grading
You can review information about how grading is configured for your course, and access student grades, at any time after you create the course. You can also make adjustments to student grading for a problem, for a single student or all students. For information about the grading data that you can access and the changes you can make, see the following topics.
- Review How Grading Is Configured for Your Course
- Generate a Grade Report for Enrolled Learners (All Courses)
- Generate a Problem Grade Report for Enrolled Students (All Courses)
- Review Grades for Enrolled Learners (Small Courses)
- Check the Progress of a Single Learner
- Adjust Grades
To review student answers to the problems in your course, you can check the answer submitted by a specified student for a selected problem, download course-wide answer data, or review a graph of all answer data for a selected problem. See Answer Data.
For information about how you establish a grading policy and work with the Problem components in your course, see Establishing a Grading Policy or Working with Problem Components.
11.12.1. Review How Grading Is Configured for Your Course
You can review the assignment types that are graded and their respective weights on the Instructor Dashboard.
You establish a grading policy for your course when you create it in Studio. While the course is running, you can view an XML representation of the assignment types in your course and how they are weighted to determine learners’ grades.
View the live version of your course.
Click Instructor, then click Data Download > Grading Configuration.
A list of the assignment types in your course displays. In this example, Homework is weighted as 0.3 (30%) of the grade.
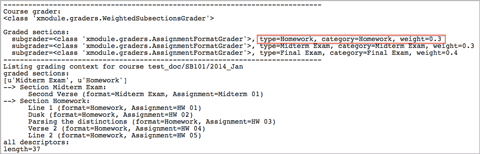
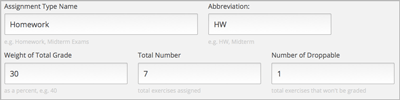
In Studio, you define this information by selecting Settings > Grading. For more information, see Configure the Assignment Types.
Important
Any changes that you make to the course grading policy, to graded subsections, or to graded components after the course begins will affect learners’ experiences in the course as well as analysis of its data. EdX recommends that you announce any unavoidable changes learners by using, for example, the Course Info page. You should also carefully track these changes for researchers.
11.12.2. Generate a Grade Report for Enrolled Learners (All Courses)
For any course, you can generate grades and then download a file with the results for each enrolled learner.
When you initiate calculations to grade student work, a process starts on the edX servers. The complexity of your grading configuration and the number of students enrolled in your course affect how long this process takes. You can download a report of the calculated grades in a comma-separated values (.csv) file when the grading process is complete.
For courses with fewer than 200 students enrolled, you also have the option to review student grades on the Instructor Dashboard. See Review Grades for Enrolled Learners (Small Courses).
To generate and download the grade report for the learners who are currently enrolled in your course, follow these steps.
Important
Because the grade report file contains confidential, personally identifiable data which might be subject to the Family Educational Rights and Privacy Act (FERPA), be sure to follow your institution’s data stewardship policies when you open or save this file.
View the live version of your course.
Click Instructor, then click Data Download.
To start the grading process, click Generate Grade Report.
A status message indicates that the grading process is in progress. This process can take some time to complete, but you can navigate away from this page and do other work while it runs.
To check the progress of the grading process, reload the page in your browser and scroll down to the Pending Tasks section. The status of active tasks is shown in the table.
When the report is complete, a linked .csv file name becomes available above the Pending Tasks section. File names are in the format
{course_id}_grade_report_{datetime}.csv. The most recently generated reports appear at the top of the list.To open or save a grade report file, locate and click the link for the grade report you requested.
You can open .csv files in a spreadsheet application to sort, graph, and compare data.
Note
To prevent the accidental distribution of learner data, you can download grade report files only by clicking the links on this page. Do not copy these links for reuse elsewhere, as they expire within 5 minutes. The links on this page also expire if the page is open for more than 5 minutes. If necessary, refresh the page to generate new links.
11.12.2.1. Interpret the Grade Report
A grade report for your course is a time-stamped .csv file that identifies each enrolled learner by ID, email address, and username, and provides a snapshot of their cumulative course scores.
Scores in the grade report are presented by assignment. There is a column for every assignment that is included in your grading configuration: each homework, lab, midterm, final, and any other assignment type you added to your course.
Note
The grade report does not include information about individual problems within assignments, or include student answer distributions. For a report that shows problem-level information, see Generate a Problem Grade Report for Enrolled Students (All Courses).
The report indicates the enrollment track for each learner. For professional and verified track learners it also shows whether they have verified their identity. The report shows whether each learner is eligible to receive a certificate (determined by whether he has earned a passing grade at the time the report was requested), whether a certificate has been generated, and the type of certificate earned.
If your course includes cohorts or content experiments, the grade report includes additional columns indicating the name of the cohort or experiment group that each learner belongs to.
The grade report .csv file contains one row of data for each learner, and columns that provide the following information.
- Learner identifiers, including an internal id, email address, and username.
- The overall grade, with the total score a learner has currently attained in the course. This value is expressed as a decimal: a learner with a grade of 0.65 has earned 65% of the credit in the course, and a learner with a grade of 1 has earned 100%.
- Each {assignment type} {number} defined in your grading configuration, with the score that the learner attained for that specific assignment. For example, column HW 03 shows the scores for the third homework assignment.
- An {assignment type} Avg with each learner’s current average score for that assignment type: for example, HW Avg.
- If cohorts are used in the course, a Cohort Name column indicates the name of the cohort that each learner belongs to, including the default cohort. The column is empty for learners who are not yet assigned to a cohort.
- If content experiments are used in the course, an Experiment Group column indicates the name of the experiment group that each learner belongs to within a group configuration. The column heading includes the name of the group configuration. The column is empty for learners who are not assigned to an experiment group. If you have more than one experiment group configuration in your course, you see one column for each group configuration.
- The Enrollment Track column indicates whether each learner is enrolled in the course in the honor code, verified, or professional education track.
- The Verification Status column applies only to learners who are enrolled in the verified or professional tracks. The value in this column indicates whether the verified or professional education learner has verified her identity to edX by using a webcam to submit her photo and an official ID.
- The Certificate Eligible column indicates whether a learner is eligible for a certificate for your course. The value in this column is “Y” for learners who attained a passing grade before this report was requested, and for all whitelisted learners, regardless of grade attained. The value is “N” for learners who did not attain a passing grade and for those who live in embargoed countries.
- For learners who are eligible to receive a certificate, the Certificate Delivered column has a value of “Y” when the certificates for a course have been generated. The value is “N” for learners who are not eligible to receive a certificate.
- The Certificate Type column indicates the type of certificate that the learner is eligible for, such as “honor” or “verified”. If a learner is not eligible for a certificate, or if the certificates for a course have not yet been generated, the value in this column is “N/A”.
11.12.3. Generate a Problem Grade Report for Enrolled Students (All Courses)
For any course, you can calculate grades for problems and generate a report that can be downloaded. The problem grade report for a course shows the number points that each learner has earned for each problem and the number of possible points for every problem in the course and the . In addition, the report shows the final grade score for each learner.
To generate and download the problem grade report for the learners who are currently enrolled in your course, follow these steps.
Important
Because the problem grade report file contains confidential, personally identifiable data which might be subject to the Family Educational Rights and Privacy Act (FERPA), be sure to follow your institution’s data stewardship policies when you open or save this file.
View the live version of your course.
Click Instructor, then click Data Download.
To start the problem grading process, click Generate Problem Grade Report.
A status message indicates that the problem grading process is in progress. This process can take some time to complete, but you can navigate away from this page and do other work while it runs.
To check the progress of the problem grading process, reload the page in your browser and scroll down to the Pending Tasks section. The status of active tasks is shown in the table.
When the report is complete, a linked .csv file name becomes available above the Pending Tasks section. File names are in the format
{course_id}_problem_grade_report_{datetime}.csv. The most recently generated reports appear at the top of the list.To open or save a problem grade report file, locate and click the link for the problem grade report you requested.
You can open .csv files in a spreadsheet application to sort, graph, and compare data.
Note
To prevent the accidental distribution of learner data, you can download problem grade report files only by clicking the links on this page. Do not copy these links for reuse elsewhere, as they expire within 5 minutes. The links on this page also expire if the page is open for more than 5 minutes. If necessary, refresh the page to generate new links.
11.12.3.1. Interpret the Problem Grade Report
A problem grade report for your course is a time-stamped .csv file that identifies each enrolled learner by ID, email address, and username, and provides a snapshot of earned scores compared with the possible scores for each problem.
The problem grade report includes two columns for every problem that is included in your grading configuration. For each homework, lab, midterm, or final exam problem, there is one column for earned points, and one column for possible points. In addition, the report shows the final grade score for each learner, espressed as a decimal.

The .csv file contains one row of data for each learner, and columns that provide the following information.
- Learner identifiers, including an internal Student ID, Email address, and Username.
- The Final Grade, with the total score that a learner has currently attained in the course. This value is expressed as a decimal: a learner with a grade of 0.65 has earned 65% of the credit in the course, and a learner with a grade of 1 has earned 100%.
- For each problem (identified by assignment, subsection, and problem name), a column showing the number of points actually earned by each learner. If a learner has not viewed a problem, the value in this column is “N/A”. If a learner has not answered a problem, the value in this column is “0”.
- For each problem (identified by assignment, subsection, and problem name), a column showing the number of points that it is possible to earn for the problem. If a learner has not viewed a problem, the value in this column is “N/A”.
11.12.4. Review Grades for Enrolled Learners (Small Courses)
For courses with enrollments of up to 200 learners, you can review a gradebook on the Instructor Dashboard.
View the live version of your course.
Click Instructor, then click Student Admin. For courses with fewer than 200 students enrolled, this tab includes a Student Gradebook section.
Click View Gradebook. Grades are calculated and the gradebook displays.
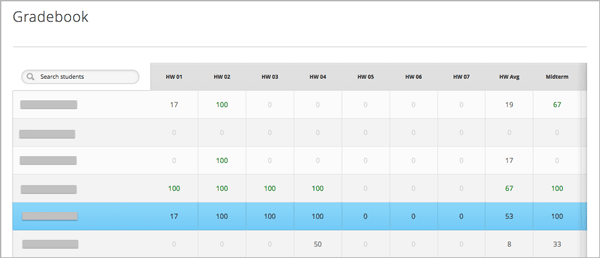
The gradebook includes the following features.
You can click the username in each row to review that learner’s Course Progress page. See Check the Progress of a Single Learner.
There is a column for each {assignment type} {number} defined in your grading configuration, with the scores that the learner attained for that specific assignment.
The gradebook does not have a scroll bar, but it can be dragged: to see columns that are hidden at one side of the grade book, click the gradebook and then drag left or right to reveal those columns.
For assignment types that include more than one assignment, an {assignment type} Avg column displays each learner’s current average score for that assignment type.
The Total column presents the total score that each learner has currently attained in the course. This value is expressed as a whole number: a learner with a grade of 65 has earned 65% of the credit in the course, and a learner with a grade of 100 has earned 100%.
To filter the data that displays you can use the Search students option. This option is case-sensitive and limits the rows shown in the gradebook to usernames that match your entry.
11.12.5. Check the Progress of a Single Learner
To check a single learner’s progress, you can locate the specific row on the grade report or review the learner’s Progress page. The Progress page includes a chart that plots the score the learner has earned for every graded assignment and the total grade as of the current date. Below the chart, each assignment and the score attained are listed.
To review a learner’s Progress page, you supply an email address or username. You can check the progress for learners who are either enrolled in, or who have unenrolled from, the course.
Learners can view a similar chart and assignment list (of their own progress only) when they are logged in to the course. See A Learner’s View of Course Progress.
To view the Progress page for a learner, follow these steps.
View the live version of your course.
Click Instructor, then click Student Admin.
In the Student-Specific Grade Inspection section, enter the student’s email address or username.
Click Student Progress Page.
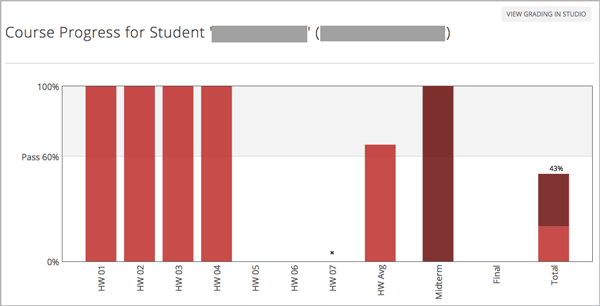
The Progress page for the learner displays a chart with the grade for each homework, lab, midterm, final, and any other assignment types in your course, and the total grade earned for the course to date. The chart does not reflect any cohort or experiment group assignments.
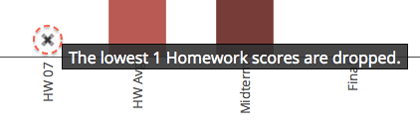
To learn more about a particular assignment, move the cursor onto the value in the chart. A brief description displays.
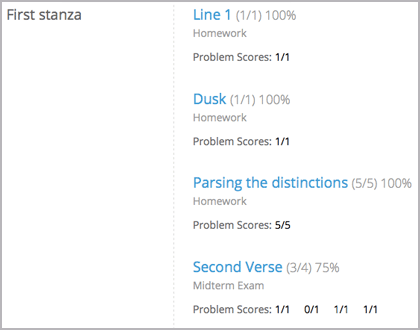
Below the chart, subsections are listed on the left and the units that contain assignments are listed on the right. The learner’s individual problem scores display.
11.12.5.1. Interpret the Student Progress Page
The chart of a learner’s scores on the Progress page and the rows of data on the grade report present assignment scores in a similar order. However, the total, cumulative score earned for the course is placed in a different position on the Progress page.
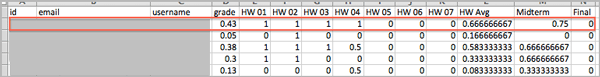
In this example grade report, the indicated learner has a current grade of 0.43 (43%).
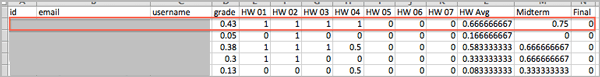
On each of the first four homework assignments the learner scored 1 (100%), but currently has a 0 (0%) on each of the remaining three assignments.
Notice, however, that the learner’s current average score for homework assignments is listed as 0.666666667 (67%): in this course, the homework assignment with the lowest score is dropped, so this average is over six assignments rather than all seven.
The learner has a score of 0.75 (75%) on the midterm, and a score of 0 (0%) on the final.
On the learner’s Progress page, you see the same information graphically represented; however, the student’s “total” of 43% is on the far right.
The chart on the Progress page includes y-axis labels for the grade ranges defined for the course. In this example, Pass is set to 60%, so at the end of the course, learners with a grade of 0.60 or higher can receive certificates.
Note
Learner scores on the Progress page are a snapshot of the current state of the problem score database. They can, at times, be out of sync with actual problem scores. For example, asynchronicities can occur if the weight of a live problem was changed during an assignment, and not all learners have resubmitted their answers for that problem.
11.12.5.2. A Learner’s View of Course Progress
Learners can check their progress by clicking Progress in the course navigation bar. The learner’s progress through the graded part of the course displays at the top of this page, above the subsection scores. Progress is visualized as a chart with entries for all the assignments, total percentage earned in the course so far, and percent needed for each grade cutoff. Here is an example of a learner’s progress through edX101.
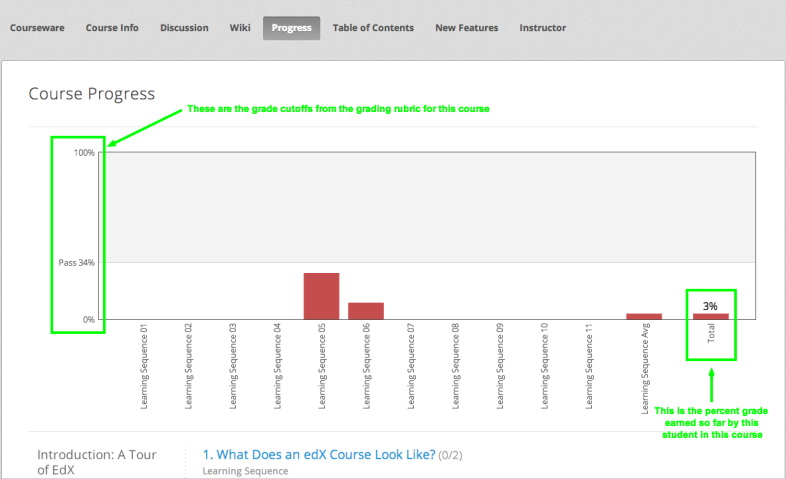
The learner can see from this page that edX101 was graded as a Pass/Fail course with a cutoff of 34% and that the grading rubric contained one assignment type, called Learning Sequence, consisting of 11 assignments total. Furthermore, this particular learner has only submitted correct responses to two assignments, and her current total percent grade in the course is 6%. By hovering over each progress bar, learners can get further statistics of how much each assignment was counted as.
Further down on the Progress page is a list of all the subsections in the course, with the scores recorded for the learner for all problems in the course. Here is the Progress page for the learner in the example above:
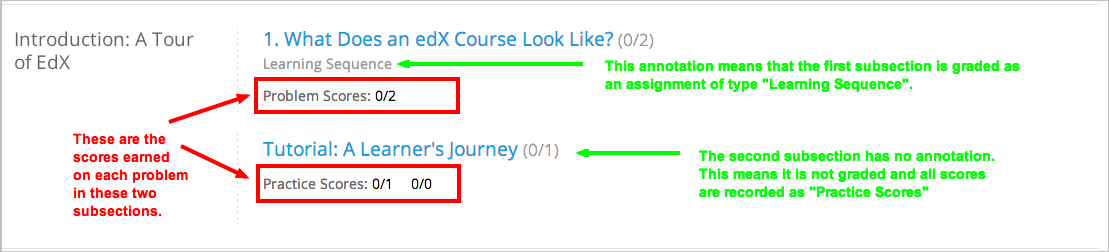
Note that point scores from graded sections are called “Problem Scores”, while point scores from ungraded sections are called “Practice Scores”.
11.12.6. Adjust Grades
If you modify a problem or its settings after learners have attempted to answer it, learners’ grades can be affected. For information about making changes to problems in Studio, see Modifying a Released Problem.
To recalculate the grades of affected learners when a correction or other change is unavoidable, you can make the following adjustments.
- Rescore the submitted answer to reevaluate student work on a problem. You can rescore a problem for a single learner or for all of the students enrolled in the course. See Rescore Student Submissions for a Problem.
- Reset the number of times a learner has attempted to answer a problem to zero so that he can try again. You can reset the number of attempts for a single learner or for all learners enrolled in the course. See Reset Student Attempts for a Problem.
- Delete a learners’s database history, or “state”, completely for a problem. You can only delete learner state for one learner at a time. For example, you realize that a problem needs to be rewritten after only a few of your students have answered it. To resolve this situation, you rewrite the problem and then delete learner state only for the affected students so that they can try again. See Delete Student State for a Problem.
To make adjustments to learner grades, you need the unique location identifier of the modified problem. See Find the Unique Location Identifier for a Problem.
11.12.6.1. Find the Unique Location Identifier for a Problem
When you create each of the problems for a course, edX assigns a unique location to it. To make grading adjustments for a problem, or to view data about it, you need to specify the problem location.
To find the unique location identifier for a problem:
View the live version of your course.
Click Courseware and navigate to the unit that contains the problem.
Display the problem and then click Staff Debug Info.
Information about the problem displays, including its location.
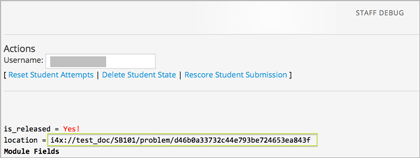
- To copy the location of the problem, select the entire location, right click, and choose Copy.
To close the Staff Debug viewer, click on the browser page outside of the viewer.
11.12.6.2. Rescore Student Submissions for a Problem
Each problem that you define for your course includes a correct answer, and may also include a tolerance or acceptable alternatives. If you decide to make a change to these values, you can rescore any responses that were already submitted. For a specified problem, you can rescore the work submitted by a single student, or rescore the submissions made by every enrolled student.
Note
You can only rescore problems that have a correct answer entered in edX Studio. This procedure cannot be used to rescore problems that are scored by an external grader.
11.12.6.2.1. Rescore a Submission for an Individual Student
To rescore a problem for a single student, you need that student’s username or email address.
- View the live version of your course.
- Click Courseware and navigate to the component that contains the problem you want to rescore.
- Display the problem, then click Staff Debug Info. The Staff Debug viewer opens.
- In the Username field, enter the student’s email address or username, then click Rescore Student Submission. A message indicates a successful adjustment.
- To close the Staff Debug viewer, click on the browser page outside of the viewer.
11.12.6.2.2. Rescore Submissions for All Students
To specify the problem you want to rescore, you need its location identifier. See Find the Unique Location Identifier for a Problem. To rescore a problem:
View the live version of your course.
Click Instructor, then click Student Admin.
In the Course-Specific Grade Adjustment section of the page, enter the unique problem location, and then click Rescore ALL students’ problem submissions.
When you see a dialog box that notifies you that the rescore process is in progress, click OK.
This process can take some time to complete for all enrolled students. The process runs in the background, so you can navigate away from this page and do other work while it runs.
To view the results of the rescore process, click either Show Background Task History for Student or Show Background Task History for Problem.
A table displays the status of the rescore process for each student or problem.
Note
You can use a similar procedure to rescore the submission for a problem by a single student. You work in the Student-Specific Grade Adjustment section of the page to enter both the student’s email address or username and the unique problem identifier, and then click Rescore Student Submission.
11.12.6.3. Reset Student Attempts for a Problem
When you create a problem, you can limit the number of times that a student can try to answer that problem correctly. If unexpected issues occur for a problem, you can reset the value for one particular student’s attempts back to zero so that the student can begin work over again. If the unexpected behavior affects all of the students in your course, you can reset the number of attempts for all students to zero.
11.12.6.3.1. Reset Attempts for an Individual Student
To reset the number of attempts for a single student, you need that student’s username or email address.
- View the live version of your course.
- Click Courseware and navigate to the component that contains the problem you want to reset.
- Display the problem, then click Staff Debug Info. The Staff Debug viewer opens.
- In the Username field, enter the student’s email address or username, then click Reset Student Attempts. A message indicates a successful adjustment.
- To close the Staff Debug viewer, click on the browser page outside of the viewer.
11.12.6.3.2. Reset Attempts for All Students
To reset the number of attempts that all enrolled students have for a problem, you need the unique identifier of the problem. See Find the Unique Location Identifier for a Problem. To reset attempts for all students:
View the live version of your course.
Click Instructor, then click Student Admin.
To reset the number of attempts for all enrolled students, you work in the Course-Specific Grade Adjustment section of the page. Enter the unique problem location, then click Reset ALL students’ attempts.
A dialog opens to indicate that the reset process is in progress. Click OK.
This process can take some time to complete. The process runs in the background, so you can navigate away from this page and do other work while it runs.
To view the results of the reset process, click either Show Background Task History for Student or Show Background Task History for Problem.
A table displays the status of the reset process for each student or problem.
Note
You can use a similar procedure to reset problem attempts for a single student. You work in the Student-Specific Grade Adjustment section of the page to enter both the student’s email address or username and the unique problem identifier, and then click Reset Student Attempts.
11.12.6.4. Delete Student State for a Problem
To delete a student’s entire history for a problem from the database, you need that student’s username or email address.
Important
Student state is deleted permanently by this process. This action cannot be undone.
You can use either the Staff Debug viewer or the Instructor Dashboard to delete student state.
To use the Staff Debug viewer:
- View the live version of your course.
- Click Courseware and navigate to the component that contains the problem.
- Display the problem, then click Staff Debug Info. The Staff Debug viewer opens.
- In the Username field, enter the student’s email address or username, then click Delete Student State. A message indicates a successful adjustment.
- To close the Staff Debug viewer, click on the browser page outside of the viewer.
To use the Instructor Dashboard, you need the unique identifier of the problem. See Find the Unique Location Identifier for a Problem.
- Click Instructor, then click Student Admin.
- In the Student-Specific Grade Adjustment section of the page, enter both the student’s email address or username and the unique problem identifier, and then click Delete Student State for Problem.