12.10. Answer Data
To review student answers to the problems in your course, you can review the answer submitted by a selected student for a specific problem, download a course-wide report of answer data, or review a histogram of student answers for a selected problem.
- Check a Student’s Answer Submission and Submission History
- Student Answer Distribution
- View a Histogram of Scores for a Single Problem
12.10.1. Check a Student’s Answer Submission and Submission History
For a single student and problem, you can review the exact response submitted, the number of attempts made, and the date and time of the submission. You identify the student by supplying a username.
To review a response submitted by a student:
- View the live version of your course.
- Click Courseware and navigate to the unit that contains the problem you want to review.
- Display the problem and then click Submission History below the problem.
- Enter the username for the student whose work you want to review, then click View History at the end of the page.
Information about the response or responses provided by the student displays.
To close the Submission History Viewer, click on the browser page outside of the viewer.
12.10.2. Student Answer Distribution
For certain types of problems in your course, you can download a CSV file with data about the distribution of student answers. Student answer distribution data is included in the file for problems of these types:
- Checkboxes (
<choiceresponse>) - Dropdown (
<optionresponse>) - Multiple choice (
<multiplechoiceresponse>) - Numerical input (
<numericalresponse>) - Text input (
<stringresponse>) - Math expression input (
<formularesponse>)
The file includes a row for each problem-answer combination selected by your students. For example, for a problem that has a total of five possible answers the file includes up to five rows, one for each answer selected by at least one student. For problems with Randomization enabled in Studio (sometimes called rerandomization), there is one row for each problem-variant-answer combination selected by your students. See Problem Settings.
The CSV file contains the following columns:
| Column | Description |
|---|---|
| ModuleID | The internal identifier for the Problem component. |
| PartID | For a Problem component that contains multiple problems, the internal identifier for each individual problem. For a Problem component that contains a single problem, the internal identifier of that problem. |
| Correct Answer | 0 if this AnswerValue is incorrect, or 1 if this AnswerValue is correct. |
| Count | The number of times that students entered or selected this answer as their most recent submission for the problem or problem variant. For problems with the number of Attempts set to a value greater than 1, this means that each student contributes a maximum of 1 to this count, even if the same answer is provided in multiple attempts. |
| ValueID | The internal identifier of the answer choice for checkboxes and multiple choice problems. Blank for dropdown, numerical input, text input, and math expression input problems. |
| AnswerValue | The text label of the answer choice for checkboxes, dropdown, and multiple choice problems. The value entered by the student for numerical input, text input, and math expression input problems. |
| Variant | For problems that use the Randomization setting in Studio, contains the unique identifier for a variant of the problem. Blank for problems that do not use the Randomization setting, or that use the Never option for this setting. |
| Problem Display Name | The Display Name defined for the problem. |
| Question | The label for accessibility that appears above the answer choices or the text entry field for the problem. In Studio’s Simple Editor, this text is surrounded by two pairs of angle brackets (>>Question<<). Blank for questions that do not have an accessibility label defined. |
Entries are sorted by the value in each column, starting with the ModuleID on the left and continuing through the columns to the right.
12.10.2.1. Download the Student Answer Distribution Report
An automated process runs periodically on the edX servers to update the CSV file of student answer data. A link to the most recently updated version of the CSV file is available on the Instructor Dashboard.
To download the most recent file of student answer data:
- View the live version of your course.
- Click Instructor, then click Data Download.
- At the bottom of the page, click the
{course_id}_answer_distribution.csvfile name. You may have to scroll down to find this file.
12.10.2.2. Frequently Asked Questions about the Student Answer Distribution Report
Answers to questions about the student answer distribution report follow.
My course doesn’t have a student answer distribution report. How can I generate it?
Student answer distribution reports are generated automatically, and refreshed
several times each day. The {course_id}_answer_distribution.csv file
displays after all of the {course_id}_grade_report_{date}.csv files. Be sure
to scroll to the end of the list of available reports.
Why are some problems missing from this report? The ones that are missing do have the problem types listed under Answer Data.
This report includes only problems that at least one student has answered since early March 2014. For those problems, this report only includes activity that occurred after October 2013.
Why don’t I see an AnswerValue for some of my problems?
For checkboxes and multiple choice problems, the answer choices actually selected by a student after early March 2014 display as described in the previous answer. Answer choices selected by at least one student after October 2013, but not selected since early March 2014, are included on the report but do not include an AnswerValue. The ValueID does display the internal identifiers, such as choice_1 and choice_2, for those answers.
Why don’t I see a Question for some of my problems?
The value in the Question column is the accessibility label for the problem. For more information about how to set up labels for problems, see Creating Exercises and Tools.
Also, for problems that use the Randomization setting in Studio, if a particular answer has not been selected since early March 2014, the Question is blank for that answer.
My students are saying that they answered a question, but it isn’t showing up in the report. How can that be?
Only questions that have a Maximum Attempts setting of 1 or higher are included on the report.
I made a correction to a problem after it was released. How can I tell which students tried to answer it before I made the change?
Problem Count values reflect the entire problem history. If you change a problem after it is released, it may not be possible for you to determine which answers were given before and after you made the change.
Why is the same answer showing up in two different rows when I view the report in a spreadsheet?
Some spreadsheet applications can alter the data in the CSV report for display purposes. For example, for different student answers of “0.5” and ”.5” Excel correctly includes the two different lines from the CSV, but displays the AnswerValue on both of them as “0.5”. If you notice answers that appear to be the same on separate lines with separate counts, you can review the actual, unaltered data by opening the CSV file in a text editor.
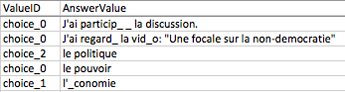
Why are there strange characters in the report when I view it in a spreadsheet?
The CSV file is UTF-8 encoded, but not all spreadsheet applications interpret and render UTF-8 encoded characters correctly. For example, a student answer distribution report with answer values in French displays differently in Microsoft Excel for Mac than in OpenOffice Calc.
Answer Values in Microsoft Excel for Mac:
Answer Values in OpenOffice Calc:
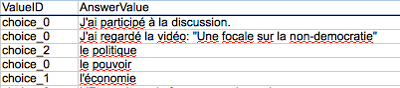
If you notice characters that do not display as expected in a spreadsheet, try a different spreadsheet application such as LibreOffice or Apache OpenOffice to open the CSV file.
12.10.2.3. Interpret the Student Answer Distribution Report
You can use the Student Answer Distribution report to review student responses to assignments, which can then help you evaluate the structure and completeness of your courseware and problem components.
As an example, you define a text input question in Studio to have a single correct answer, “Warfarin”. When you produce the Student Answer Distribution report, you verify that this answer was in fact marked correct: there is a 1 in the Correct Answer column for this AnswerValue.
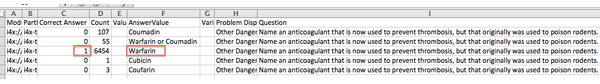
However, as you view the report you notice other student answers that you did not set up to be marked as correct in Studio, but that you might (or might not) also consider to be correct, such as “Warfarin or Coumadin”. The Correct Answer column shows that the other answers were marked incorrect (0), but for future iterations of your course you may want to revise the question or update the problem to evaluate additional variations of the answer as correct.
Many spreadsheet applications offer data visualization options, such as charts or graphs. Charts can help make your students’ common misconceptions easier to identify.
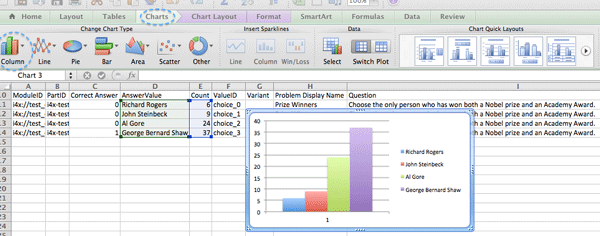
In this example, the Student Answer Distribution report is open in Microsoft Excel. To create a chart that shows how many of your students chose various answers to a multiple choice question, you move the AnswerValue and Count columns next to each other. After you click and drag to select the report cells that contain the data you want to chart, you click the Charts toolbar and then click the type of chart you want.
Note
Refer to the help for the spreadsheet application that you use for information on using these options. You may have to make changes to your spreadsheet, such as reordering columns. Save a copy of the file you originally downloaded as a backup before you begin.
You can adjust your course content based on common student mistakes. While most students in this example selected the correct answer, the number of incorrect answer(s) can guide future changes to the courseware.
12.10.3. View a Histogram of Scores for a Single Problem
You can view a chart of the score distribution for a specified problem.
Note
To view the score distribution for a problem, you need its unique identifier. You can display a histogram for problems that have the /problem/ prefix in the unique identifier. See Find the Unique Location Identifier for a Problem.
To display the distribution of scores for a problem:
View the live version of your course.
Click Instructor, then click Analytics.
In the Score Distribution section, select a problem by using its unique identifier.
The Analytics page updates to display a histogram of scores for that problem.
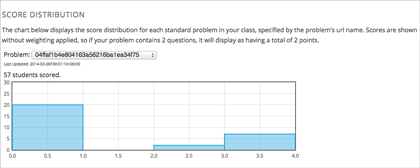
12.10.3.1. Interpret a Score Histogram
The histogram of scores for a selected problem provides the following information.
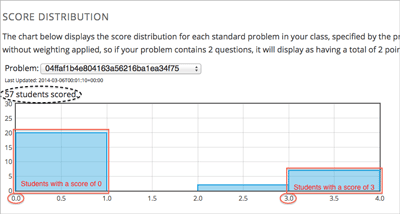
- The x-axis indicates the number of points that students can receive for the problem, unweighted. Although decimal values are marked on the x-axis, each score is a whole number. The whole number value at the left of a plotted bar is the score that applies to it.
- The y-axis indicates the number of students who have answered and checked the problem.
- Above the graph, a number of students scored displays. This number indicates the total number of database records that exist for the problem: it includes not only students who have answered and checked the problem to receive a score, but also students who have opened the problem but not yet completed it.
- An automated process runs approximately weekly on the edX servers to update score histograms. This process runs less frequently than the process that updates the student answer distribution report: at certain times during a course the number of students shown in a score histogram can be quite different than the Count for the same problem in a student answer distribution report.